By Fifth Element Business AI.

KNOW YOUR BUSINESS

14 Essential Business Terms—Illustrated and Explained

Understand the numbers. Ask better questions. Make more confident decisions.

  • Understand what each term means.
  • See it explained through a practical example.
  • Test what you remember.

Optimized PDF · High-resolution edition

Illustrated business terms guide

See it. Understand it. Put it to work.

Each illustration connects a term to a simple idea. Read its meaning, work through the example, then cover the answer and test your recall. The picture is a memory aid; the written definition gives the precise meaning.

01 / 14 · Profitability & cash

Gross Margin

Also called gross profit margin

Gross Margin concept illustration on deep navy

Remember it

REMEMBER IT What remains from each sales dollar.

Gross Margin

Test your recall

Revenue is $100 and direct cost is $60. What is gross margin?

40%.

How much of each sales dollar is left after delivering what you sell?

The percentage of revenue remaining after direct production or delivery costs. COGS means Cost of Goods Sold; service businesses may call these costs cost of services or cost of revenue.

Example. A business sells $100,000 of work and incurs $60,000 in direct costs. Gross profit is $40,000; gross margin is 40%. That leaves 40 cents per sales dollar to cover overhead and other expenses.

Gross profit = Revenue − COGS
Gross margin (%) = (Gross profit ÷ Revenue) × 100

Why it matters. Helps you see whether pricing and delivery costs leave enough room to operate profitably.

Understand the distinction. Revenue minus COGS gives gross profit in dollars. Divide by revenue and multiply by 100 for gross margin as a percentage. This is not final take-home profit.

Ask yourself. Which product or service leaves the most money after its direct costs?

Reference: Salesforce: Gross profit margin

02 / 14 · Profitability & cash

EBITDA

Earnings Before Interest, Taxes, Depreciation, and Amortization

EBITDA concept illustration on deep navy

Remember it

REMEMBER IT Earnings before four items.

Earnings Before Interest, Taxes, Depreciation, and Amortization

Test your recall

Does EBITDA equal cash available to spend?

No. Cash needs such as equipment and debt payments differ.

What do earnings look like before these four items?

An earnings measure that adds interest, income taxes, depreciation, and amortization back to net income. Depreciation spreads tangible asset costs over time; amortization does the same for certain intangible assets.

Example. Net income of $80,000 + $10,000 interest + $20,000 income taxes + $15,000 depreciation + $5,000 amortization = $130,000 EBITDA.

EBITDA = Net income + Interest + Income taxes + Depreciation + Amortization

Why it matters. Useful when discussing business performance and valuation, provided everyone uses the same calculation.

Understand the distinction. EBITDA is not cash flow. Equipment purchases, debt principal payments, and money tied up in unpaid invoices can consume cash. “Adjusted EBITDA” includes extra adjustments that must be explained.

Ask yourself. Can we reconcile our EBITDA to the accounting records and explain each adjustment?

Reference: SEC: Non-GAAP financial measures, questions 103.01–103.02

03 / 14 · Profitability & cash

Net Burn

Net cash burn rate

Net Burn concept illustration on deep navy

Remember it

REMEMBER IT The cash reserves you use up.

Net cash burn rate

Test your recall

Cash out is $50,000 and operating cash in is $35,000. Net burn?

$15,000 for that period.

How quickly are we using our cash reserves?

The cash a business uses over a period after subtracting cash coming in from operations. It is usually tracked monthly. This example uses operating cash burn and excludes new loans and investor funding.

Example. Pay out $50,000 and collect $35,000 in a month: net burn is $15,000. With $90,000 of available cash, that suggests six months of runway if the same burn continues and no other cash needs arise.

Monthly operating net burn = Operating cash paid out − Operating cash received

Why it matters. Shows how much time you have to improve collections, spending, or funding before available cash runs out.

Understand the distinction. Use cash collected, not merely invoices issued. New borrowing can increase the bank balance without improving operations. Track equipment purchases and debt payments separately in the full cash forecast. Negative net burn means operating cash generation under this convention.

Ask yourself. How many months can we operate at our current cash usage?

04 / 14 · Profitability & cash

Working Capital

WC - Working Capital

Working Capital concept illustration on deep navy

Remember it

REMEMBER IT Near-term assets minus near-term bills.

Working Capital

Test your recall

Current assets are $100,000 and current liabilities are $60,000. Working capital?

$40,000; it is not necessarily all cash.

How do our near-term assets compare with our near-term obligations?

Current assets minus current liabilities. Current assets include cash, receivables, and inventory; current liabilities include bills and debt due in the near term, generally within a year or the operating cycle.

Example. Current assets of $100,000 minus current liabilities of $60,000 leave $40,000 in working capital.

Working capital = Current assets − Current liabilities

Why it matters. Helps you understand the resources tied to day-to-day operations and short-term obligations.

Understand the distinction. Working capital is not cash in the bank. Inventory can be slow to sell and receivables slow to collect. Positive working capital does not guarantee timely bill payment. Negative working capital can work in some fast-collection business models.

Ask yourself. Will cash from our current assets arrive before our bills are due?

Reference: CFI: Working capital formula

05 / 14 · Sales growth

MRR

Monthly Recurring Revenue

MRR concept illustration on deep navy

Remember it

REMEMBER IT The monthly repeat.

Monthly Recurring Revenue

Test your recall

Ten ongoing plans at $200 per month produce what MRR?

$2,000.

What recurring revenue does our current customer base represent each month?

The monthly value of active recurring subscriptions or service agreements. Normalize longer billing periods to one month and exclude one-time sales.

Example. Twenty clients on $500 monthly service plans produce $10,000 MRR. An annual subscription priced at $1,200 contributes $100 MRR, even if paid upfront.

MRR = Sum of the monthly recurring value of active customer agreements

Why it matters. Helps you see whether your recurring revenue base is growing or shrinking.

Understand the distinction. MRR is not total monthly sales, profit, or cash collected. Do not count an entire annual payment in one month. Renewals and collection are not guaranteed.

Ask yourself. How much of next month’s revenue comes from ongoing agreements?

Reference: Paddle: Monthly recurring revenue

06 / 14 · Sales growth

ARR

Annual Recurring Revenue

ARR concept illustration on deep navy

Remember it

REMEMBER IT The annual recurring pace.

Annual Recurring Revenue

Test your recall

At $2,000 MRR, what is ARR?

$24,000, using ARR = MRR × 12.

What does our recurring revenue base represent at an annual pace?

The annualized recurring value of the current customer base. For a consistent monthly subscription base, ARR is MRR multiplied by 12.

Example. A business with $10,000 MRR has $120,000 ARR. That is the current recurring annual pace, not a guarantee that it will collect $120,000 over the next year.

ARR = MRR × 12

Why it matters. Makes recurring revenue easier to discuss on an annual basis and compare over time.

Understand the distinction. ARR is not last year’s total sales or guaranteed future revenue. Exclude one-time projects. ACV annualizes one contract; ARR aggregates the recurring customer base. Use consistent definitions for usage-based or variable contracts.

Ask yourself. How much of our business is recurring, and is that base growing?

Reference: Paddle: Annual recurring revenue

07 / 14 · Sales growth

ACV

Annual Contract Value

ACV concept illustration on deep navy

Remember it

REMEMBER IT One contract. One year’s value.

Annual Contract Value

Test your recall

A $36,000 contract lasts three years, with no one-time fees. ACV?

$12,000.

What is one customer contract worth per year?

The annualized value of one customer contract. For this guide, exclude one-time fees so ongoing contracts can be compared consistently.

Example. A three-year service agreement totals $36,000, with no one-time fees. Its ACV is $12,000, even if the billing schedule differs.

ACV = Contract value excluding one-time fees ÷ Contract length in years

Why it matters. Helps compare contract sizes and assess the sales effort and delivery costs each account can support.

Understand the distinction. ACV is not profit or cash collected. It is not the whole company’s Annual Recurring Revenue (ARR). Definitions vary, so label your treatment of fees and use it consistently.

Ask yourself. What does a typical contract generate annually, and what does it cost to win and serve?

Reference: Paddle: Annual contract value

08 / 14 · Sales growth

CAC

Customer Acquisition Cost

CAC concept illustration on deep navy

Remember it

REMEMBER IT The cost to win one customer.

Customer Acquisition Cost

Test your recall

Spend $3,000 and win ten customers. CAC?

$300 per customer.

What does it cost us to win one new customer?

The average sales and marketing cost of acquiring a new paying customer. Include relevant wages, commissions, advertising, agency fees, and tools, not only ad spending.

Example. A business spends $6,000 on acquisition and gains 20 new customers in the measurement period. Its average CAC is $300.

CAC = Acquisition sales and marketing costs ÷ New customers acquired

Why it matters. Helps you judge whether customer growth can produce enough profit to cover its cost.

Understand the distinction. Count customers, not leads. Align costs and wins with the sales cycle; a long delay can distort a single-month calculation. Compare CAC with customer contribution and retention, not just the first sale’s revenue.

Ask yourself. How long does the profit contribution from a new customer take to recover acquisition cost?

Reference: Paddle: Customer acquisition cost

09 / 14 · Sales growth

Pipeline Coverage

Sales pipeline coverage ratio

Pipeline Coverage concept illustration on deep navy

Remember it

REMEMBER IT Potential deals behind the goal.

Potential deals compared with the sales target

Test your recall

Pipeline is $300,000 and the matching period’s target is $100,000. Coverage?

3×; it does not guarantee the goal.

Do we have enough potential deals to support our sales goal?

The value of qualified open sales opportunities compared with a sales target for the same period. Qualified means there is a credible buying opportunity, not just a name on a prospect list.

Example. You have $300,000 of qualified opportunities expected to close this quarter against a $100,000 quarterly goal. Coverage is 3×.

Coverage = Qualified open pipeline value ÷ Sales target for the same period

Why it matters. Shows when more prospecting or stronger follow-up may be needed.

Understand the distinction. 3× is an example, not a universal safe target. Win rates and deal timing matter. Some systems divide by the remaining target after closed sales; label which method you use. Never mix annual deal values with a monthly target.

Ask yourself. Which opportunities can realistically close during the period we are measuring?

Reference: HubSpot: Sales pipeline coverage

10 / 14 · Sales growth

Expansion Revenue

Additional revenue from existing customers

Expansion Revenue concept illustration on deep navy

Remember it

REMEMBER IT Same customers. More value purchased.

Additional revenue from existing customers

Test your recall

A customer raises their plan from $500 to $700 a month. Expansion?

$200 per month.

Are current customers buying more because we provide more value?

Additional revenue from customers you already serve, such as upgrades, added services, or more users. In subscription reporting, track the recurring increase separately from one-time purchases.

Example. An existing client increases a monthly service plan from $1,000 to $1,500. That adds $500 in monthly expansion revenue, or $6,000 annualized if the increase continues for a full year.

Expansion revenue = Sum of additional revenue from existing customers during the period

Why it matters. Helps you see growth opportunities inside relationships you have already earned.

Understand the distinction. A renewal at the same price retains revenue but does not expand it. New customers are separate. Track cancellations and downgrades too; expansion alone does not show net growth.

Ask yourself. What additional problem could we solve for customers who already trust us?

Reference: Paddle: Expansion revenue

11 / 14 · Sales growth

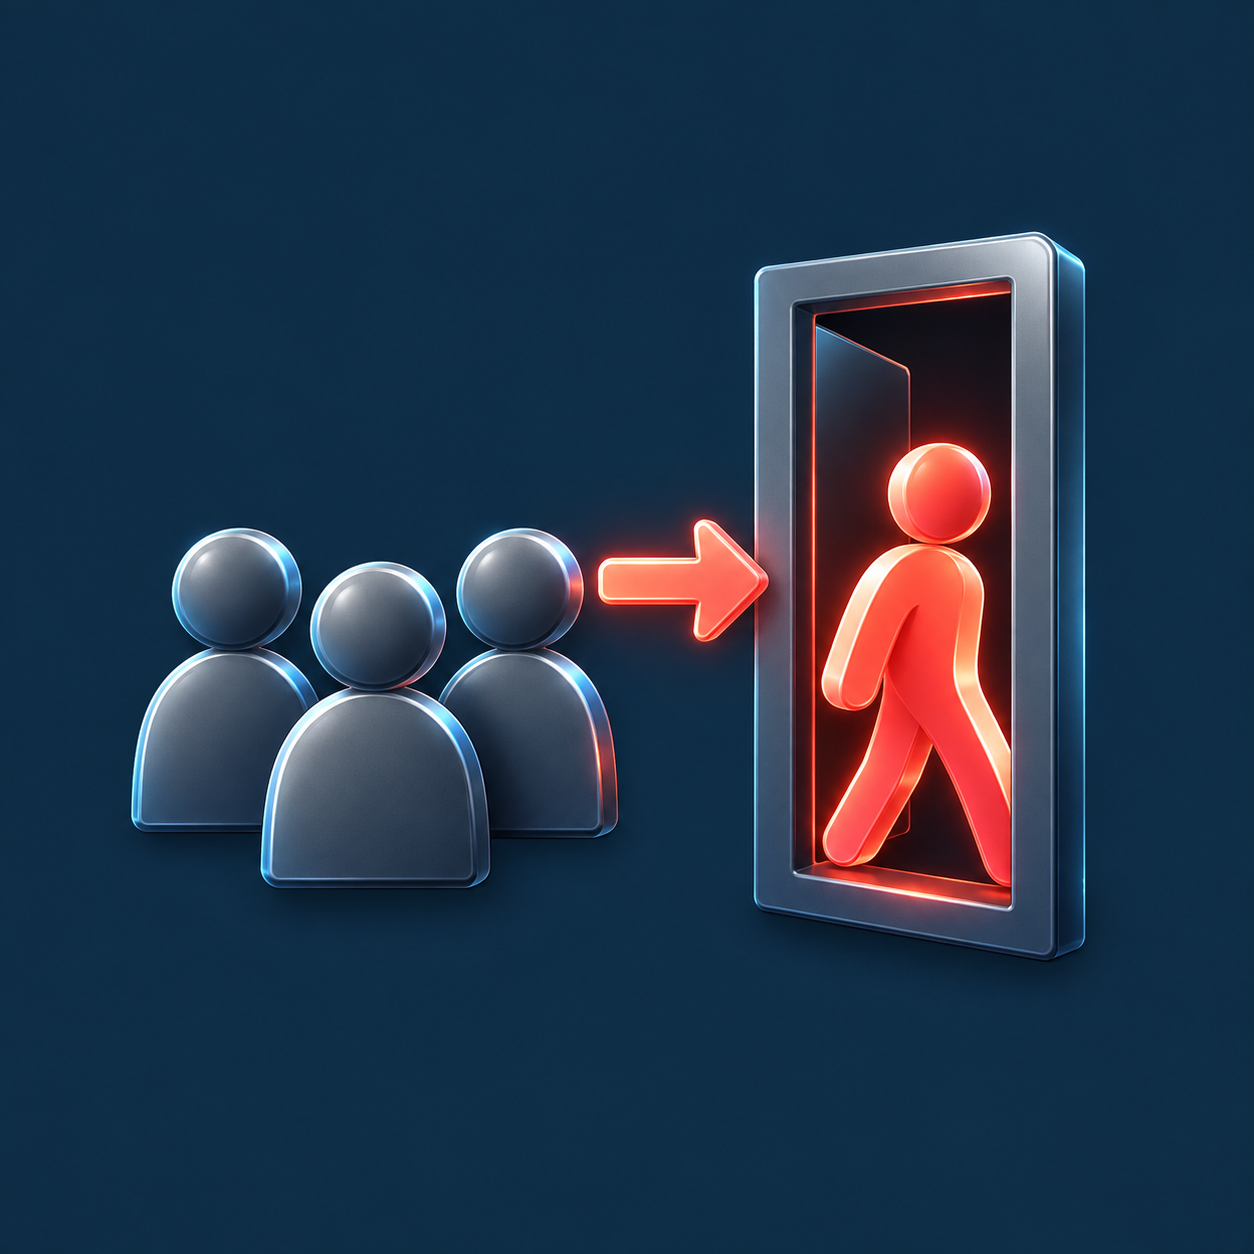
Churn

Customer churn rate

Churn concept illustration on deep navy

Remember it

REMEMBER IT Customers walking out.

Customer churn rate

Test your recall

Lose five of 100 starting customers. Customer churn?

5% for that period.

What share of our existing customers are we losing?

Customer churn measures how many customers stop using or paying for a service during a defined period. This guide uses the customers present at the beginning of that period as the starting group.

Example. Start the month with 100 customers and lose five of those customers. Monthly customer churn is 5%, even if new customers also join that month.

Customer churn (%) = Customers lost from starting group ÷ Customers at start × 100

Why it matters. Shows how much customer loss the business must replace before it can grow.

Understand the distinction. Customer churn counts customers; revenue churn measures lost recurring revenue. They can differ greatly. Keep monthly and annual rates separate and define when a customer counts as lost. A completed one-time project is not automatically churn.

Ask yourself. Why are customers leaving, and which preventable reason appears most often?

Reference: Paddle: Customer churn analysis

12 / 14 · Ownership & business value

Enterprise Value

EV — Enterprise Value

Enterprise Value concept illustration on deep navy

Remember it

REMEMBER IT The value of the whole business.

Enterprise Value

Test your recall

Equity value is $1m, debt $300k, cash $100k. Simplified EV?

$1.2 million.

How is the value of the business related to the value of its ownership?

A measure of total business value that includes financing claims and subtracts cash. It helps compare businesses with different amounts of debt and cash.

Example. Equity valued at $1,000,000 + debt of $300,000 − cash of $100,000 = enterprise value of $1,200,000.

Simplified EV = Equity value + Debt − Cash
Simplified equity value = EV − Debt + Cash

Why it matters. Helps owners understand why a headline business valuation differs from the value attributable to shareholders.

Understand the distinction. Use the value of equity, not simply the balance-sheet equity figure. More complete calculations can include preferred equity and noncontrolling interests. Sale proceeds also depend on deal terms, working-capital adjustments, fees, and other obligations.

Ask yourself. When someone quotes a valuation, do they mean enterprise value or equity value?

Reference: CFI: Enterprise value

13 / 14 · Ownership & business value

Dilution

A reduction in ownership percentage

Dilution concept illustration on deep navy

Remember it

REMEMBER IT Same shares. Smaller percentage.

A reduction in ownership percentage

Test your recall

You own 100 shares. Total shares rise from 100 to 125. Your stake?

80%, if your holdings stay at 100 shares.

How much of the company will I own after new shares are issued?

Your ownership percentage becomes smaller when the company issues additional shares and your holdings do not increase proportionately.

Example. You own 100 of 100 shares: 100%. The company issues 25 new shares to an investor. You still own 100 shares, but now own 100 ÷ 125 = 80%. The investor owns 20%.

Ownership (%) = Shares you own ÷ Total shares outstanding × 100

Why it matters. Helps you understand the ownership trade-off when raising money or granting equity.

Understand the distinction. A smaller percentage does not automatically mean a lower dollar value. Fully diluted calculations also consider potential shares from options and convertible instruments. Voting and economic rights may differ.

Ask yourself. What will each person own after this transaction, including promised or convertible equity?

Reference: Carta: Share dilution

14 / 14 · Ownership & business value

Vesting Cliff

The initial waiting period before equity begins to vest

Vesting Cliff concept illustration on deep navy

Remember it

REMEMBER IT Wait. Then earn the first portion.

The wait before the first portion vests

Test your recall

Does a one-year cliff always mean the whole grant vests at year one?

No. The agreement specifies the portion and later schedule.

When does someone earn the first portion of an equity grant?

A vesting cliff is the minimum period or condition that must be satisfied before the first portion of a grant becomes vested. Vesting means earning rights under the grant’s terms.

Example. For a 4,800-option grant on that schedule: none vest before month 12; 1,200 vest at month 12; then 100 vest each month for the next 36 months.

Illustrative schedule: 4 years total; 1-year cliff; monthly vesting afterward

Why it matters. Helps founders, employees, and partners understand how equity is earned over time.

Understand the distinction. The agreement controls the schedule and departure rules. Vesting an option earns the right to exercise it; it does not automatically create share ownership or pay cash. The cliff does not necessarily vest the entire grant.

Ask yourself. What vests, on what date, and what happens if someone leaves?

Reference: Carta: Vesting schedules and cliffs

KNOW YOUR BUSINESS

Send the guide to your inbox.

Get the illustrated 14-term guide by email. The guide is yours whether or not you opt in to additional educational emails.

Put the terms into context

See where value may be getting stuck.

Take the Free Business Growth Scan for a preliminary view of possible bottlenecks and priority moves. Free. No credit card.

Start My Free Scan

General business education. Accounting methods and contract terms can change how these concepts apply. Examples are hypothetical. Illustrations are memory aids, not data charts.